Cloudwatch RUM: Enhancing User Experience Monitoring
Collecting data about users’ interactions with web applications can significantly enhance overall user experience. CloudWatch RUM (Real User Monitoring) by AWS allows you to monitor application performance directly from your users’ browsers. This is powerful because it provides real-time insight into metrics like page load times, client-side errors, and user behaviors.
With CloudWatch RUM, application developers can identify and debug issues efficiently. This real user monitoring tool provides detailed dashboards and traces that help in optimizing application performance across different devices and browsers. By inspecting the client-side performance, developers can take proactive steps to resolve issues before they affect more users.
Implementing CloudWatch RUM starts with setting up an application on AWS, creating an app monitor, and integrating the necessary code snippets into your web application. These steps are straightforward and are designed to help developers get an in-depth look into how their applications are performing in real user environments.
Key Takeaways
- CloudWatch RUM offers real-time monitoring of web applications.
- It helps in identifying, debugging, and optimizing client-side performance.
- Easy setup and integration into existing AWS applications.
Understanding Cloudwatch RUM
Amazon Cloudwatch RUM offers tools for monitoring real user interactions with web applications. This monitoring focuses on client-side performance, user behavior, and quickly identifying and resolving issues.
What Is Amazon Cloudwatch RUM
Amazon Cloudwatch RUM (Real User Monitoring) is a service from Amazon Web Services that tracks actual user interactions on web applications. It collects data on page load times, client-side errors, and user behavior in near real-time. This helps developers see exactly how their applications perform in the real world, not just in isolated tests. RUM enables a detailed view of performance metrics, making it easier to diagnose and resolve client-side performance issues.
The Importance of RUM for Application Performance
Using Real User Monitoring is crucial for understanding how your application performs in real-world scenarios. It identifies slow page load times, areas where users experience errors, and other performance issues that could affect user experience. With insights from RUM, developers can make informed decisions to enhance the application. This leads to reduced downtime and faster resolution of issues, improving the overall user experience.
Key Features of Cloudwatch RUM
Cloudwatch RUM offers several key features:
- Real-time Tracking: It tracks user sessions and collects data in near real-time, allowing for timely troubleshooting.
- Detailed Metrics: Users get detailed metrics on load times, error rates, and user behavior, which help pinpoint performance bottlenecks.
- Visualization Tools: Integration with tools like Amazon Managed Grafana provides dashboards and visualizations to analyze the collected data. This helps in making data-driven decisions to improve app performance.
- Aggregated Data: It aggregates data from multiple sources, offering a comprehensive view of application performance across different user sessions.
These features make Cloudwatch RUM an essential tool for maintaining and improving the performance of web applications.
Getting Started with Cloudwatch RUM
Setting up Cloudwatch RUM involves authorizing your application to send data to AWS, creating an app monitor, and configuring the RUM web client. Each step ensures that real user monitoring (RUM) data is accurately captured and monitored.
Setting Up Cloudwatch RUM
To begin, authorize your application to send data to AWS. This typically involves configuring AWS Identity and Access Management (IAM) roles. After authorization, the next step is to create an app monitor.
An app monitor in Cloudwatch RUM starts by generating a JavaScript snippet. This snippet is essential as it pulls in the RUM web client code. The JavaScript snippet needs to be inserted into your application. This setup allows Cloudwatch RUM to capture data from user sessions and send it to AWS for monitoring.
Finally, testing the setup is crucial. Generate user events to see if Cloudwatch RUM correctly captures and sends data.
Configuring the RUM Web Client
Once the JavaScript snippet is in place, configure the RUM web client. Manual modifications to the snippet might be necessary to fine-tune how the RUM client behaves.
For example, setting sampling rates, custom error handling, or additional user data can be configured here. These configurations play a critical role in ensuring that the data collected fits your specific needs.
It's also possible to integrate with other services like Application Signals or X-Ray for more detailed insights. Integrating with Application Signals helps visualize service health metrics and dependencies, enhancing your application's monitoring capabilities even further.
Proper configuration ensures accurate and useful monitoring data is collected from the client-side, leading to better decision-making based on real user experiences.
Monitoring Application Performance
Amazon CloudWatch RUM helps in monitoring application performance by analyzing user sessions and behaviors, identifying client-side performance issues, and visualizing core web vitals and page load times.
Analyzing User Sessions and Behaviors
With CloudWatch RUM, developers can collect data from real user sessions. It captures detailed information about user interactions, including clicks, navigation paths, and session duration. This data provides insights into user behavior patterns and helps in understanding which parts of the application are most frequently used or need improvements.
By examining these behaviors, organizations can tailor their applications to better meet user needs, enhancing overall user satisfaction. This detailed monitoring ensures that any anomalies or unexpected user actions are quickly identified and addressed.
Identifying Client-Side Performance Issues
CloudWatch RUM helps in pinpointing client-side performance issues. Developers can monitor client-side errors such as JavaScript exceptions, network requests, and responsiveness. By using this data, issues can be debugged faster, improving the mean time to resolve (MTTR).
Identifying these issues early in the user journey helps in maintaining smooth and efficient application performance. The ability to drill down into specific errors and user interactions aids in precise troubleshooting.
Visualizing Core Web Vitals and Page Load Times
CloudWatch RUM visualizes core web vitals, which include key performance indicators like Largest Contentful Paint (LCP), First Input Delay (FID), and Cumulative Layout Shift (CLS). These metrics are crucial for measuring the user experience.
Page load times, another important aspect, are also tracked. By visualizing these metrics, developers can see how their applications perform in real-world conditions. This helps in optimizing load times and improving the overall speed and reliability of the application.
By presenting performance data in easy-to-understand visual formats, CloudWatch RUM enables quick insights into the health and efficiency of web applications.
Understanding RUM Data
RUM provides a comprehensive set of data about user interactions, errors, and device metrics. This helps in optimizing web applications by identifying performance bottlenecks and anomalies.
Data Items Collected by RUM
RUM collects various data points to give insights into user sessions. These include page load times, client-side errors, and user interactions. By analyzing these metrics, developers can find and fix issues that degrade performance. Specifically, RUM captures data about HTTP requests, response times, and JavaScript errors to ensure smooth operation.
A table can illustrate the key data items:
| Data Item | Description |
|---|---|
| Page Load Time | Time taken to load a web page |
| HTTP Errors | Errors related to HTTP requests/responses |
| JavaScript Errors | Errors thrown by scripts running on the page |
| User Interactions | Clicks, scrolls, and other user actions |
Anomalies and Error Messages Reporting
RUM also focuses on identifying anomalies in user sessions. Anomalies could be unusual spikes in page load times or unexpected HTTP errors. By highlighting these irregularities, developers can take proactive measures to prevent larger issues.
Error messages are also recorded, and detailed reports are generated. These reports provide a breakdown of client-side errors, latency issues, and failed requests. This is crucial for debugging and improving user experience.
Geolocations and Device Metrics
Another critical aspect of RUM is capturing geolocations and device metrics. This helps in understanding how web applications perform across different regions and devices. For instance, users in a specific location might experience slower load times due to network issues.
Geolocation data includes the user's country, region, and city. Device metrics cover details like browser type, OS version, and screen resolution. By analyzing this data, developers can optimize their applications for diverse environments.
Geolocation and device metrics can be broken down as follows:
| Metric Type | Details Captured |
|---|---|
| Geolocations | Country, Region, City |
| Device Metrics | Browser Type, OS Version, Screen Resolution |
Understanding these metrics helps in delivering a consistent and efficient user experience globally.
Troubleshooting with CloudWatch RUM
CloudWatch RUM enables developers to monitor real-user interactions and identify client-side issues quickly. Key elements like debugging JavaScript errors, analyzing stack traces, and using curated dashboards are crucial for effective troubleshooting.
Debugging JavaScript Errors
JavaScript errors can cause significant problems in web applications. When a JavaScript error occurs, CloudWatch RUM captures detailed error information. This includes the error message, the URL where the error happened, and even the user’s actions that led to the error. This Debugging Data helps developers identify and fix the bugs faster.
To make error tracking easier, you should prioritize frequent and critical errors. CloudWatch RUM helps by organizing these errors, allowing developers to focus on what impacts users the most. Reducing the Mean Time to Resolve (MTTR) becomes feasible with this targeted approach.
Stack Traces and Dependency Analysis
Stack traces are essential for understanding the flow of code execution when an error occurs. CloudWatch RUM provides detailed Stack Traces that help pinpoint the exact location and cause of a problem. Alongside, it can reveal which dependencies are involved in the issue.
Analyzing these dependencies ensures that developers understand how different parts of the application interact. This insight allows for efficient debugging and helps in resolving complex issues that involve multiple layers of the application. By quickly identifying problematic dependencies, MTTR is significantly reduced.
Using Curated Dashboards to Visualize Anomalies
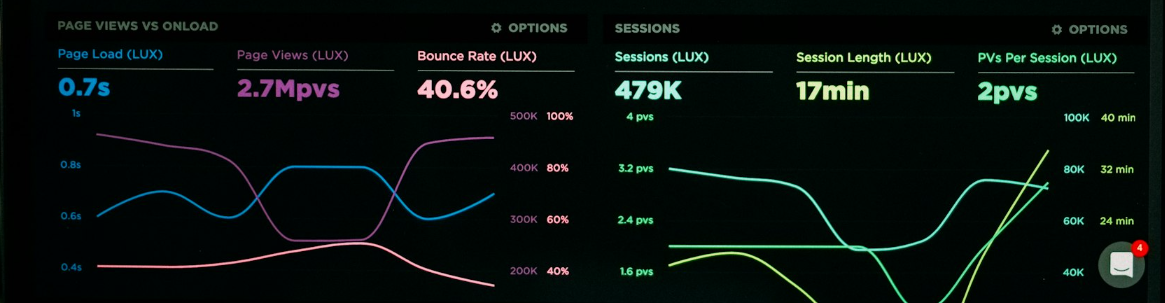
Visualizing anomalies in user data is crucial for maintaining application performance. CloudWatch RUM offers curated dashboards that Visualize Anomalies by displaying key metrics like page load times, error rates, and user engagement. These dashboards can be customized to focus on the most relevant data for your application.
Using these dashboards, teams can spot trends and anomalies at a glance. If there's a sudden spike in JavaScript errors or if load times increase unexpectedly, the dashboard makes it easy to identify and address these issues. This proactive monitoring helps in maintaining a smooth user experience and reduces the overall MTTR.
Advanced Topics in Cloudwatch RUM
CloudWatch RUM allows users to gain deeper insights by applying custom monitoring strategies, integrating with various AWS services, and ensuring robust security practices. These advanced functions unlock significant flexibility and enhanced observability.
Custom Events and Metrics
Using CloudWatch RUM to track specific user actions can boost the quality of your monitoring. Custom events let you capture detailed information about user interactions not covered by default metrics.
For instance, tracking button clicks, form submissions, or specific page navigations. You can define these events through your RUM scripts, allowing you to visualize and analyze data in near real time.
Additionally, custom metrics provide additional granularity. You can measure application signals like response times for particular API calls or download times for specific resources. This fine-tuned monitoring helps in quickly identifying and resolving user experience issues.
Integrating with Other AWS Services
CloudWatch RUM works seamlessly with other AWS services to enhance functionality. For example, integrating with Amazon Managed Grafana enables advanced data visualization and dashboard creation.
Using AWS Lambda, you can automate responses to specific RUM Events. This can range from invoking custom alerts to triggering automatic remediation processes.
Integration with Amazon S3 allows you to store historical data and analyze trends over time. Combining RUM data with AWS X-Ray further enriches your application's observability by correlating front-end user activities with back-end trace data.
IAM Policies and Security
Security is crucial when setting up CloudWatch RUM. Implementing appropriate IAM Policies ensures that only authorized users can access sensitive monitoring data.
Define policies that grant the necessary permissions for reading and writing RUM data while following the principle of least privilege. Regularly audit and update these policies to adapt to changing security requirements.
In addition to managing IAM policies, enable encryption for data in transit and at rest. Using advanced security features such as AWS Key Management Service (KMS) enhances data protection.
By focusing on these advanced topics, users can achieve a comprehensive and secure monitoring setup tailored specifically to their application's needs.
Cloudwatch RUM in Different Environments
CloudWatch RUM is versatile, supporting various AWS regions and browsers, making it adaptable for multiple environments. It can optimize performance monitoring, particularly for single-page applications like those created with React.
Support for AWS Regions and Browsers
CloudWatch RUM is available in many AWS regions, providing wide geographical coverage. Users can set up CloudWatch RUM in any supported region and effectively monitor web applications accessed from multiple locations. This geographic flexibility ensures user sessions are logged regardless of where the users are based.
Supported browsers for CloudWatch RUM include popular choices like Chrome and Firefox. Compatibility with these browsers ensures that performance metrics and user behaviors are accurately captured and analyzed. This support is crucial for developers looking to maintain a seamless user experience across different web environments.
For more details, visit Amazon's Regionalization documentation.
Optimizing RUM for Single Page Applications
Optimizing CloudWatch RUM for single-page applications (SPAs) is important for accurate performance monitoring. SPAs, such as those built with React, require careful tracking of user interactions and client-side performance metrics.
To monitor SPAs with CloudWatch RUM, developers can set up app monitors that capture real-time data on user sessions. This includes page load times, client-side errors, and user behavior. By configuring custom events and metrics, developers can gain deeper insights into the performance of their SPAs.
For a step-by-step guide on using CloudWatch RUM with a React web application, check out this helpful blog post.
Best Practices and Recommendations
Proper implementation of CloudWatch RUM significantly benefits your web application by tracking user behavior and enhancing overall functionality. Below are some focused recommendations to achieve the best results.
Enhancing User Experience with RUM Data
Using CloudWatch RUM, developers can gather data on how users interact with their web applications. Key metrics like page load times, client-side errors, and user interactions provide insights into the application's performance.
Analyzing page load times helps in identifying bottlenecks that may be slowing down the user experience. Faster load times generally lead to higher user satisfaction and retention.
Monitoring client-side errors ensures that developers can quickly debug and address issues, leading to a more stable and reliable application. This reduces frustration among users caused by repeated crashes or slowdowns.
User behavior patterns can also be studied to optimize navigation paths and improve the overall design of the web application, making it more intuitive and user-friendly.
Collaboration Between Application Developers and DevOps
Close collaboration between application developers and DevOps engineers is crucial for the effective use of CloudWatch RUM.
Developers should focus on integrating CloudWatch RUM into the application code to ensure metrics are accurately captured. This involves setting up the RUM client and ensuring all necessary data points are being tracked.
DevOps engineers play a role in configuring the monitoring environment, ensuring that the collected data is correctly visualized and analyzed. They employ tools such as Amazon Managed Grafana for more robust data visualization and insights.
Communication between teams is key to ensure that performance issues identified by RUM are effectively addressed. Developers need to understand operational insights provided by DevOps to make the necessary code adjustments.
By following these practices, teams can make data-driven decisions that improve the user experience and application reliability.
Learning Resources and Support
Understanding the tools and resources available for CloudWatch RUM is essential to leveraging its full potential. From official documentation to AWS Support and community contributions, there are several avenues to explore.
Cloudwatch RUM Documentation
The most comprehensive resource available is the CloudWatch RUM Documentation. This official documentation provides detailed instructions on setting up and configuring CloudWatch RUM, troubleshooting common issues, and optimizing performance. It includes step-by-step guides, best practices, and detailed descriptions of features such as monitoring client-side errors and analyzing user behavior. Users can access sample codes, tutorials, and advanced configurations to make the most out of CloudWatch RUM.
Engaging with AWS Support
If additional help is needed, users can engage with AWS Support. AWS Support offers various plans ranging from basic free-tier support to premium support packages with 24/7 access to engineers. The support team can help resolve technical issues, provide personalized guidance, and offer insights based on specific use cases. Users can also access the AWS Knowledge Center, which contains articles and FAQs, and take advantage of the AWS Support forums to connect with other CloudWatch RUM users.
Community Contributions
Community contributions are another valuable resource. Sites like GitHub host open-source projects and sample codes that demonstrate how to integrate CloudWatch RUM with other tools, such as Amazon Managed Grafana. AWS blog posts also share detailed real-world applications, use cases, and best practices from experienced developers. Joining community forums and attending AWS events can provide opportunities to share experiences, ask questions, and learn from peers who have successfully implemented CloudWatch RUM in their projects.
Frequently Asked Questions
AWS CloudWatch Real User Monitoring (RUM) offers several features for tracking user interactions and application performance. This section addresses common questions about pricing, integration, and usage.
How is pricing structured for AWS CloudWatch Real User Monitoring (RUM)?
Pricing for AWS CloudWatch RUM is based on the number of events recorded. Users are charged per million events, which include page views and user interactions. To get more detailed information, visit the AWS CloudWatch pricing page.
What are the key differences between AWS CloudWatch RUM and Sentry for error tracking and performance monitoring?
AWS CloudWatch RUM focuses on real-time user monitoring with data on page load times, errors, and user behavior. Sentry, on the other hand, specializes in error tracking and performance monitoring, providing stack traces and detailed debugging information. For more details on CloudWatch RUM, explore this CloudWatch RUM documentation.
How can AWS CloudWatch RUM be integrated using the AWS Cloud Development Kit (CDK)?
To integrate CloudWatch RUM with the AWS CDK, first create an app monitor resource. Next, configure it to capture the necessary events. Finally, deploy your CDK stack to apply the configuration. This integration simplifies the deployment and management processes.
What steps are involved in instrumenting an application with CloudWatch RUM for React environments?
To instrument a React application with CloudWatch RUM, follow these steps: authorize your application, create an app monitor, modify and insert the code snippet into your application, and test the setup. Detailed instructions can be found here.
How can custom events be configured and used within AWS CloudWatch RUM?
Custom events in AWS CloudWatch RUM can be configured to monitor specific user interactions. This involves setting up events in your app's code and defining what data to capture. These events provide deeper insights into user behavior and application performance. Learn more about custom events here.
What options are available for visualizing and analyzing data on the CloudWatch RUM dashboard?
The CloudWatch RUM dashboard offers a variety of visualizations such as page load times, error rates, user session data, and Apdex scores. Users can also filter by browser, device, and geographic location to analyze performance metrics in depth. Find out more about the dashboard features here.